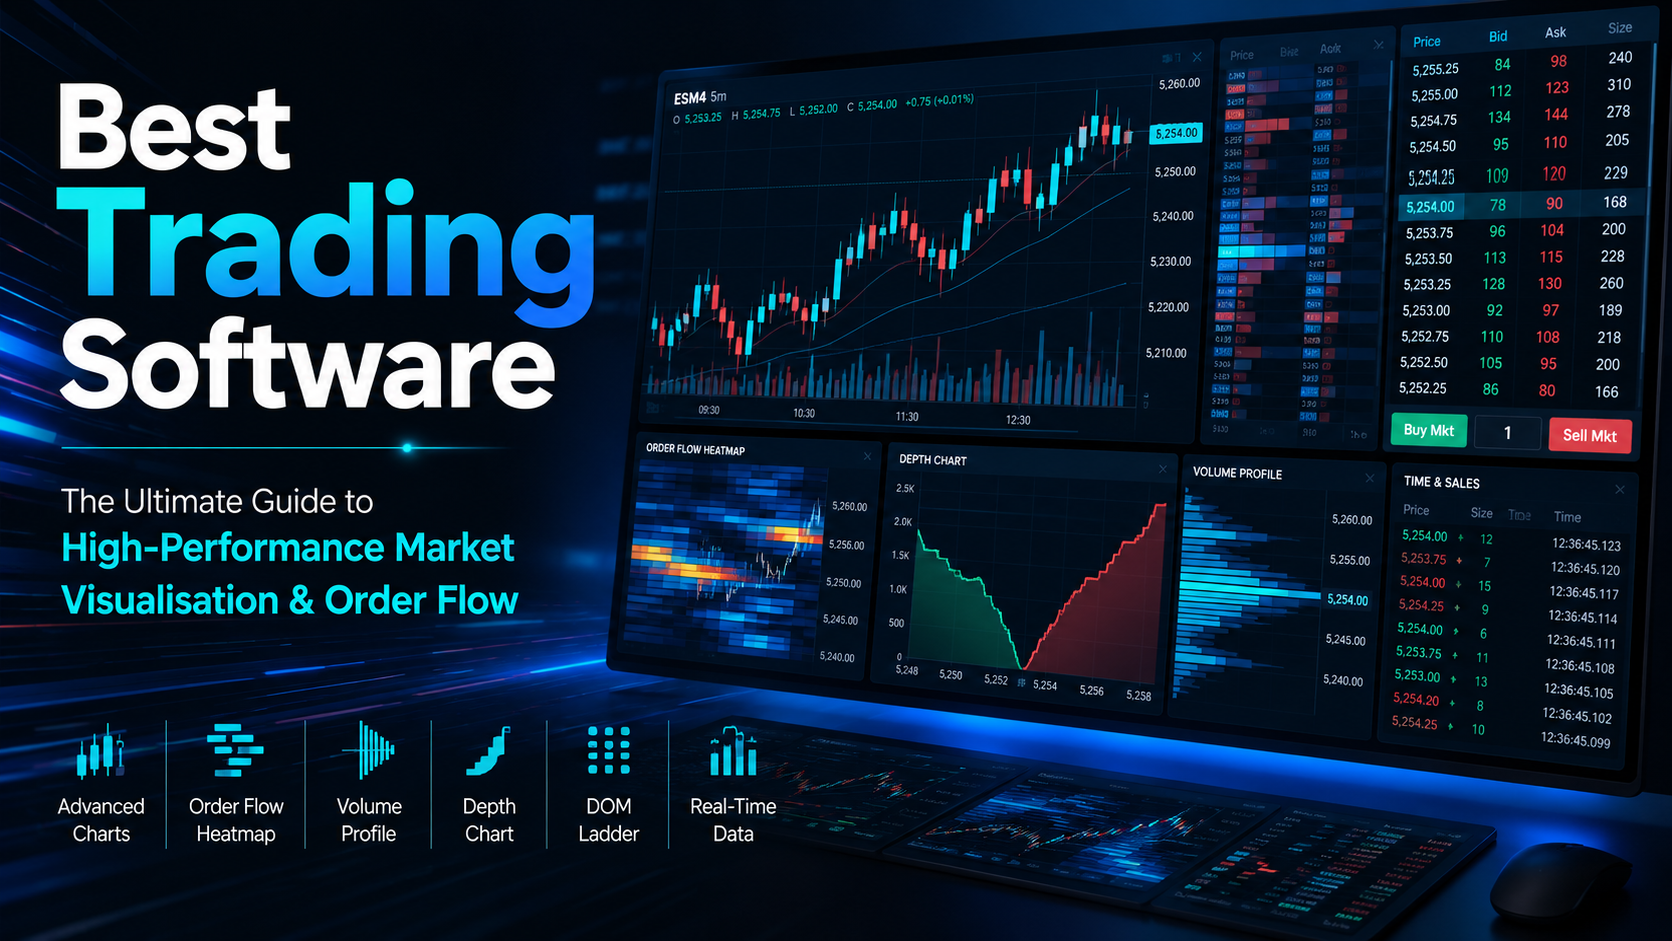

Quick Summary: Finding the Best Trading Software
Selecting the best trading software requires moving beyond lagging technical indicators and delayed price graphs. Active day traders, quantitative analysts, and institutional scalpers rely on platforms that expose raw market depth, limit order book dynamics, and real-time order flow.
Modern trading software must process non-aggregated Level 2 and Market-by-Order (MBO) data feeds to reveal where institutional buyers and sellers are placing liquidity walls. By transforming complex order books into real-time heatmaps, platforms like Bookmap allow market participants to see market manipulation, absorption, and iceberg orders as they occur.
- Primary Focus: Order flow visualisation, Level 2 depth, ultra-low latency execution, and tick-by-tick data streaming.
- Key Supported Assets: Futures (E-mini S&P 500, Nasdaq 100, Dow Jones), US Equities, Options, and Cryptocurrencies.
- Top Platform Choice: Bookmap provides an industry-leading visual heatmap engine, API integration, and direct market access for precision trading.
What Makes Bookmap the Best Trading Software?
The landscape of financial software has shifted dramatically. Traditional platforms rely on bar or candlestick charts, which summarize price activity over fixed time intervals (e.g., 1 minute or 5 minutes). However, candlesticks hide crucial information occurring inside the bar—such as how many contracts were traded at the bid versus the ask, or whether a large buyer absorbed all selling pressure.
Bookmap solves this problem by visualizing the entire history of the limit order book alongside executed transactions. Instead of guessing where support and resistance lie based on past price bounces, traders can see resting limit buy and sell orders on a dynamic color-coded heatmap.
+———————————————————————————–+
| VISUAL ORDER FLOW ARCHITECTURE |
+———————————————————————————–+
| [ Limit Order Book ] –> Real-time Depth of Market (DOM) / Level II Data |
| [ Heatmap Engine ] –> Color-coded historical map of resting liquidity |
| [ Executed Volume ] –> Volume Bubbles (Aggressive Buy / Sell Market Orders) |
| [ Order Flow Delta ] –> Cumulative Volume Delta (CVD) & Iceberg Detection |
+———————————————————————————–+
Core Concepts in Modern Active Trading
To evaluate active trading software, you must understand the underlying mechanics that drive global market prices.
Live Equity Derivatives Pricing
Live equity derivatives pricing involves streaming continuous bid, ask, and transaction updates for instruments whose value derives from underlying assets. Unlike delayed retail charts, live pricing processes micro-second fluctuations across global electronic communication networks (ECNs). High-performance platforms ingest raw exchange feeds to calculate implied volatility, fair value basis points, and order book imbalance instantly.
Streaming Index Forward Contracts
Index futures—such as the S&P 500, Nasdaq 100, and Dow Jones—trade as forward agreements on centralized exchanges like the CME Group. Streaming index forward contracts update continuously across global trading sessions. Viewing these streaming contracts in high definition allows traders to identify momentum shifts before they reflect in cash equity index values.
Up to the Minute Financial Benchmark Quotes
Securing up to the minute financial benchmark quotes requires direct exchange data access. A true benchmark quote does not aggregate or filter tick data. When trading liquid instruments, receiving unfiltered tick-by-tick quotes ensures that every executed trade and limit order adjustment is accounted for on your charting workspace.
Identifying Your Trading Requirements
Before selecting a platform, traders should evaluate their operational scope, asset focus, and technical infrastructure needs.
Are You Looking for US Benchmarks Like the SPX or Individual Company Agreements?
Traders focusing on broad US benchmarks—such as the SPX (via E-mini ES or Micro MES futures)—benefit from immense market depth, tight spreads, and continuous liquidity. Benchmark index futures respect major order book liquidity levels and macroeconomic catalysts.
Conversely, trading individual company agreements or equities requires monitoring single-stock order books, dark pool prints, and company-specific news releases. High-tier trading software handles both asset classes seamlessly, allowing traders to toggle between index futures and single-stock equities without changing interfaces.
Do You Need a Complimentary Web Graph or Professional Direct Access APIs?
Free web-based graphs are adequate for long-term investors tracking daily portfolio valuations. However, active day traders and automated strategy builders require professional direct access APIs.
Direct access software bypasses retail intermediary routing, connecting directly to liquidity providers and exchange matching engines via protocols such as FIX or native Java/Python APIs. Bookmap offers advanced L0 and L1 APIs, enabling quantitative developers to build automated algorithms that interact directly with live order book heatmaps.
Are You Trying to Monitor Overnight Trends or Actively Open Positions?
Monitoring overnight trends requires clean multi-timeframe visualization and global session data feeds. However, actively opening and managing intraday positions requires direct execution capabilities from the chart, one-click order modification, and real-time position tracker modules.
Active intraday trading demands low latency, custom bracket orders, and immediate feedback on fill execution.
High-Performance Infrastructure & Market Dynamics
+———————————————————————————–+
| MARKET DATA FEED HIERARCHY |
+———————————————————————————–+
| [ Central Exchange ] –> CME, NASDAQ, NYSE (Matching Engines) |
| [ Direct Data Feed ] –> Rithmic, dxFeed, CQG (Un-aggregated Tick Data) |
| [ Order Flow Engine] –> Bookmap Heatmap Processing & Analytics |
| [ Execution API ] –> Direct Order Routing & Brokerage Execution |
+———————————————————————————–+
Global Exchange Data Feeds
To maintain competitive execution, professional active traders subscribe to non-aggregated global exchange data feeds. Feeds provided by technology specialists like dxFeed, Rithmic, and CQG deliver full Market-by-Order (MBO) depth. MBO data allows platforms to distinguish individual limit orders in the queue, giving traders visibility into order queue priority and algorithmic order cancelations.
Round the Clock Electronic Investing
Equity futures and global derivatives operate 23 hours a day, five days a week on platforms like CME Globex. Round the clock electronic investing enables market participants to react instantly to international earnings announcements, Asian and European central bank decisions, and geopolitical developments. Maintaining access to live order flow during extended trading hours (ETH) is vital for hedging overnight portfolio risk.
Macroeconomic Indicators
Index derivatives move rapidly following scheduled macroeconomic indicator releases. Economic events such as Consumer Price Index (CPI) reports, Non-Farm Payrolls (NFP), and Federal Open Market Committee (FOMC) rate decisions induce substantial volatility.
Using visual order flow software during macroeconomic releases allows traders to observe institutional liquidity disappearing (liquidity pull) or re-entering the book to absorb aggressive selling.
Specific Instrument Deep Dives & Order Flow Visualisation
Different financial instruments exhibit distinct order book behaviors. High-performance software adapts to these unique microstructures.
CME E-mini S&P 500 Tick by Tick Chart
The E-mini S&P 500 (ES) is the benchmark liquidity instrument for global equities. Conducting a CME E-mini S&P 500 tick by tick chart analysis using Bookmap reveals dense limit order clusters. Because the ES order book is highly liquid, price movement often halts or reverses when encountering large resting limit orders (liquidity walls).
Analyzing executed volume bubbles against these limit walls provides clear evidence of market absorption or breakout momentum.
Nasdaq 100 NQ Globex Connection
The Nasdaq 100 futures contract (NQ) trades on the CME Globex platform and is renowned for its high volatility and rapid price swings. Compared to the E-mini S&P 500, the NQ order book features thinner liquidity at individual price ticks.
Connecting to the NQ via low-latency Globex data feeds allows traders to spot liquidity gaps where price can move rapidly, as well as institutional spoofing or order stacking.
Level II Depth for Dow Jones YM
The Dow Jones Industrial Average futures (YM) offer a distinct order flow profile heavily influenced by industrial and blue-chip components. Decoding Level II depth for Dow Jones YM requires monitoring resting limit orders across multiple price levels simultaneously.
Because YM moves in 1-point ticks, visualizing market depth helps traders place precise profit targets just ahead of large resting sell walls.
Real-Time Tracking & Active Execution Systems
+———————————————————————————–+
| ORDER FLOW EXECUTION TOOLSET |
+———————————————————————————–+
| Feature | Operational Advantage |
+———————–+———————————————————–+
| Heatmap Visualisation | Historical record of resting limit orders over time |
| Volume Bubbles | Displays size and aggressive buyer/seller dominance |
| Cumulative Delta (CVD)| Tracks net aggressive buying vs selling pressure |
| Iceberg Detector | Uncovers hidden algorithmic institutional execution |
+———————–+———————————————————–+
Instant Share Tracking
For equity traders, instant share tracking across multiple exchanges (NYSE, NASDAQ, BATS) is essential. Equity markets are fragmented across dozens of lit venues and dark pools. Modern trading platforms aggregate these disparate data streams into a unified order book view, ensuring traders track total executed volume and national best bid and offer (NBBO) pricing accurately.
Zero Delay Wall Street Derivatives Tracker
A zero delay Wall Street derivatives tracker processes tick data with sub-millisecond precision. Delays of even a few hundred milliseconds can cause traders to miss optimal entry prices or misinterpret order book absorption. By utilizing direct exchange connections, Bookmap processes raw derivative data without filtering or smoothing, delivering real-time visual accuracy.
Current Second Globally Traded Indices
Monitoring current second globally traded indices—including the DAX (Germany), Nikkei 225 (Japan), and FTSE 100 (UK)—provides a macro framework for US market open strategies. Global indices act as interconnected liquidity pools; strength or weakness in European benchmark indices frequently spills over into US pre-market equity futures.
Tactical Execution & Market Dynamics
How to Execute Overnight Trades
Executing overnight trades requires a systematic approach to risk management and liquidity assessment. During extended trading hours, market depth is typically lower than during Regular Trading Hours (RTH).
To execute safely overnight:
- Use Limit Orders: Avoid market orders during low-liquidity sessions to prevent slippage.
- Monitor Heatmap Liquidity: Verify that adequate limit orders exist at your target exit levels.
- Set Protective Brackets: Implement server-side stop-loss and take-profit orders directly through your platform interface.
Best Broker for Level Two Order Flow
The best broker for Level 2 order flow provides direct market access, supports non-aggregated tick data feeds, and charges transparent commission rates. Leading brokerages and data providers that integrate seamlessly with Bookmap include:
- Interactive Brokers: Global asset access with extensive API integration.
- Rithmic Data Partners (e.g., EdgeClear, AMP Futures): Ultra-low latency futures execution with full MBO depth.
- TradeStation / Tradovate: Popular options for retail futures and equity automation.
What Economic Events Drive Pre Open Volatility
Pre-market volatility (04:00 AM to 09:30 AM EST) is primarily driven by:
- US Economic Reports: CPI, PPI, Retail Sales, and Weekly Unemployment Claims released at 08:30 AM EST.
- Corporate Earnings: Major mega-cap earnings reports released before the market open.
- European Market Session Trends: European equity indices trading actively through their afternoon session.
5 Essential Features of Leading Trading Platforms
When selecting active trading software, ensure the platform provides these five essential capabilities:
- Historical Order Book Heatmap: A continuous, color-coded visual map showing where limit buy and sell orders were placed, modified, or canceled over time.
- Advanced Order Flow Analytics: Built-in indicators for Cumulative Volume Delta (CVD), Volume-Weighted Average Price (VWAP), and order book imbalance.
- Algorithmic Execution Detection: Automated detection engines that identify hidden iceberg orders and sweeping algorithm activity.
- Custom API Development: Support for Java, Python, or C# scripting to build custom indicators, backtest quantitative strategies, and automate trade execution.
- Multi-Asset & Multi-Broker Connectivity: The ability to connect to multiple brokers and data providers simultaneously within a single workspace.
Pricing, Costs, and Market Access
Investing in professional active trading software requires evaluating software subscription fees alongside market data exchange costs.
+———————————————————————————–+
| BOOKMAP SUBSCRIPTION TIERS |
+———————————————————————————–+
| Tier | Target Audience | Key Features |
+———————–+————————+———————————-+
| Digital (Free) | Crypto Enthusiasts | Real-time crypto data & heatmap |
| Global ($39-$49/mo) | Retail Futures/Stocks | Real-time stocks & futures access|
| Global+ ($79-$99/mo) | Professional / Quants | Advanced analytics & custom API |
+———————————————————————————–+
Cost Comparisons: Professional Platforms vs Retail Brokers
Traditional retail brokers often advertise “free” trading software. However, these platforms frequently monetize users through indirect costs:
- Payment for Order Flow (PFOF): Retail orders are routed to market makers, resulting in wider spreads and inferior fill quality.
- Aggregated Data Feeds: Free charting tools compress or drop tick data to reduce server bandwith, hiding critical order book changes.
- High Margin Rates: Markup on overnight positions and hidden platform maintenance fees.
In contrast, subscribing to professional software like Bookmap combined with a direct-access broker provides transparent execution, lower commissions per contract, and raw market data feeds.
[Get Started with Bookmap Today]
Platform Comparisons: Traditional Technical Analysis vs Visual Order Flow
+———————————————————————————–+
| TRADITIONAL CHARTING VS VISUAL ORDER FLOW |
+———————————————————————————–+
| Feature | Traditional Candlesticks | Bookmap Visual Order Flow |
+———————-+—————————+——————————-+
| Data Type | Summarized Open/High/Low/Close| Raw Tick & Level 2 MBO Depth |
| Resting Liquidity | Hidden / Static DOM | Full Historical Heatmap |
| Order Absorption | Invisible until candle closes| Real-time Volume Bubbles |
| Hidden Orders | Undetectable | Automated Iceberg Detector |
| Execution Precision | Bar-level estimation | Exact Tick & Queue Tracking |
+———————-+—————————+——————————-+
Why Choose Bookmap
When trading competitive global markets, having an information edge is essential. Bookmap is widely recognized as a premier solution for visual order flow analysis and market liquidity tracking.
+———————————————————————————–+
| THE BOOKMAP ADVANTAGE |
+———————————————————————————–+
| [ Unmatched Clarity ] –> Visualise full order book depth in real time |
| [ Advanced Analytics ] –> Iceberg detection, CVD, and volume footprint tools |
| [ API Flexibility ] –> Java & Python APIs for custom algo development |
| [ Global Ecosystem ] –> Connect to top futures, stock, and crypto brokers |
+———————————————————————————–+
1. Unmatched Visual Order Book Transparency
Bookmap renders raw Level 2 and MBO data into an intuitive, real-time visual heatmap. Instead of reading rapidly changing numbers on a static Depth of Market (DOM) ladder, traders instantly see where institutional liquidity is accumulating or disappearing.
2. Evidence-Based Order Flow Analytics
Bookmap equips traders with scientific, data-driven tools. Identify hidden iceberg orders, track aggressive market buy/sell sweeps with dynamic Volume Bubbles, and monitor buyer/seller exhaustion using Cumulative Volume Delta.
3. Open API for Quants & Strategy Automation
Developer-friendly L0 and L1 APIs allow quantitative traders to build custom indicators, backtest order flow strategies, and automate execution directly through the Bookmap engine.
4. Fast, Multi-Asset Market Access
Bookmap connects natively to leading data vendors (Rithmic, dxFeed, CQG) and major brokerages globally. Trade futures, US stocks, and digital assets from a single, unified workspace.
[Book a Consultation with an Expert] | [Get Started Now]
Trust, Authority, and Verified Reviews
Bookmap’s commitment to product excellence, execution speed, and educational support is reflected in verified user feedback across independent platforms.
“Bookmap completely transformed how I read market price action. Being able to see resting limit orders on the heatmap allows me to place profit targets right ahead of liquidity walls with incredible consistency.”
— Verified Active Futures Trader
“The iceberg detector alone paid for my annual subscription within the first week. Standard candlestick charts simply cannot compete with this level of order book visibility.”
— Quantitative Trading Specialist
Bookmap maintains a high customer satisfaction rating on Trustpilot, with active traders praising its software stability, responsive customer support, and educational community webinars.
Frequently Asked Questions
What is the best trading software for day trading futures?
Bookmap is widely considered a premier platform for day trading futures due to its real-time order book heatmap, non-aggregated MBO data processing, and advanced order flow analytics for contracts like the E-mini S&P 500 (ES) and Nasdaq 100 (NQ).
Can I use Bookmap with my existing broker?
Yes. Bookmap integrates seamlessly with major brokerages and market data providers worldwide, including Interactive Brokers, Rithmic, Tradovate, TradeStation, dxFeed, and CQG.
Does Bookmap support stock and crypto trading?
Yes. Bookmap supports full market depth visualization for US equities across major exchanges, as well as direct connections to over 20 global cryptocurrency exchanges, including Binance, Coinbase, and Bitfinex.
What is the difference between Level 1 and Level 2 market data?
Level 1 data displays only the top bid and ask prices (NBBO). Level 2 data (Depth of Market) provides multiple levels of resting buy and sell limit orders above and below the current market price, allowing traders to evaluate overall supply and demand.
Do I need programming skills to use Bookmap?
No. Bookmap is fully functional out of the box with an intuitive graphical interface, pre-configured heatmaps, and built-in order flow indicators. However, advanced users and quants can utilize the Java and Python APIs to build custom tools if desired.
Ready to Transform Your Trading Performance?
Gain visual clarity over global market depth, track institutional liquidity, and execute trades with precision.
